Leading and lagging sales KPIs

Domantas Mozeris
Published Date
Leading vs. Lagging Sales KPIs: 5 Actionable Metrics That Actually Fix Pipelines (2026 Guide)
It’s January 8th. The holidays are officially over, the "New Year, New Me" energy is starting to fade, and the reality of the 2026 sales target is setting in.
For most Sales Directors and CEOs, this week is dedicated to one thing: staring at spreadsheets.
When we review 2025 results and plan for 2026, we naturally gravitate toward the big, flashy numbers on the scoreboard: Revenue, Total Pipeline, and Win Rate.
But honestly? Those metrics are lazy.
They tell you exactly what happened, but they give you zero insight into what to do next. They are what we call Lagging Indicators.
If you want a dashboard that actually helps you hit your numbers in 2026, you need to stop obsessing over the past and start tracking Leading Indicators.
Here is the difference, and the 5 specific metrics you need to track right now.
The Problem: Driving with the Rearview Mirror
To understand why your dashboard might fail you, you need to understand the difference between the two types of sales data:
- Lagging KPIs (The Rearview Mirror): These measure the results of past actions.
- Examples: Revenue, Quota Attainment, Churn Rate.
- The issue: By the time you see these numbers go down, it is too late to fix them. You can't un-lose a deal from last quarter.
- Leading KPIs (The Windshield): These measure the activities that predict future results.
- Examples: Response Time, Demo Bookings, Stage Velocity.
- The benefit: If these numbers drop today, you have time to course-correct before it hits your bank account.
Most companies spend 90% of their time analyzing Lagging KPIs. In 2026, you need to flip that ratio.
Here are the 5 Leading Sales KPIs that most companies miss.
1. Lead Response Time
Speed isn't just about "customer service" - it is about survival.
When a potential buyer fills out a form or requests a quote, they are in a moment of "Peak Intent." If you wait an hour to reply, you aren't just late; you are likely out of the running.
The Data: According to research from Harvard Business Review and InsideSales, 50% of sales go to the vendor who responds first.
In B2B, the first person to speak to the human gets to anchor the price and frame the solution. By the time your competitor calls 2 hours later, they are just being compared to the standard you already set.
Action: Track this in minutes, not days.
2. Win Rate by Granular Source
"Marketing" is not a lead source. That is a lazy label.
If you are reviewing your marketing budget, you need to know exactly which channels are printing money and which are burning it. You might find that:
- Google Ads (Campaign A): Converts at 20%
- Meta (Retargeting): Converts at 5%
If you lump them both under "Digital Marketing," you end up with a blended average that hides the truth. Track the specific source so you can cut the losers and double down on the winners.
3. Win Rate by Segment
Just like lead sources, not all customers (or products) are created equal.
A 30% overall win rate is just an average, not the truth. A "Segment" can mean an industry, a product type, or even a specific sales rep. You might find that:
- You win 60% of deals in Retail, but only 10% in Manufacturing.
- Product A sells easily, while Product B stalls 9 times out of 10 (same for services).
- Rep A closes 40% of their demos, while Rep B closes only 15%.
If you don't track this, your team will waste time trying to sell the wrong product to the wrong client, simply because the "pipeline value" looks good. Find the pockets where you win easily, and shift your focus there.
4. Time-in-Stage (The Bottleneck Finder)
Knowing your average sales cycle is 2 months is fine. But knowing where those 2 months go is actionable.
Do deals fly through "Discovery" but sit in "Proposal Prep" for 4 days?
Why this matters:This isn't just about saving time; it's about momentum. Silence after a great meeting kills deals.
At Maven Labs, we saw that our proposals were taking 4 days to prep. That silence after the discovery call was killing our momentum and giving the client time to reconsider. We simplified the template to send proposals out faster, and our win rate immediately increased.
If you track Time-in-Stage, you can spot these bottlenecks. Faster processes don't just mean less work - they mean more wins.
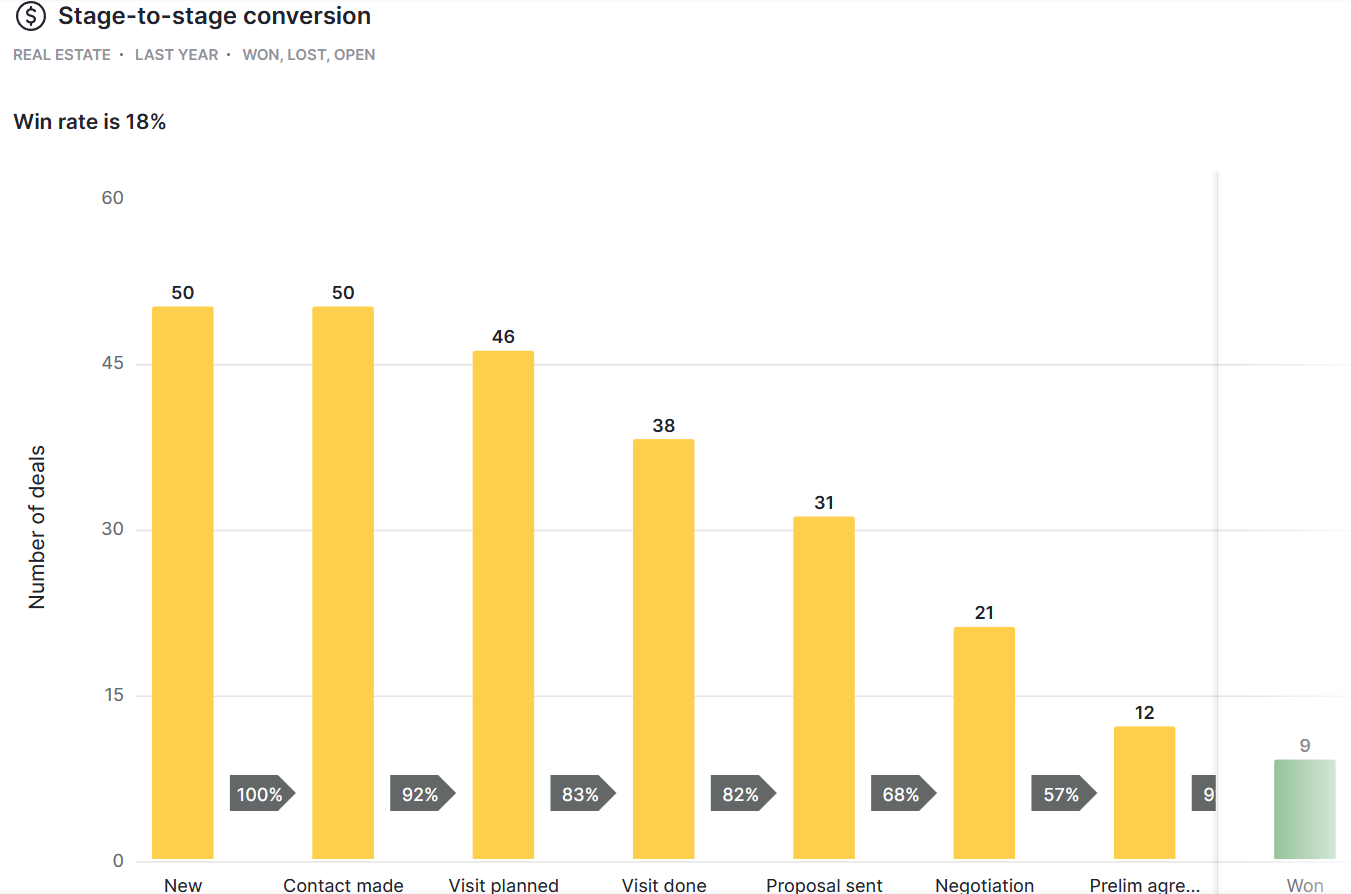
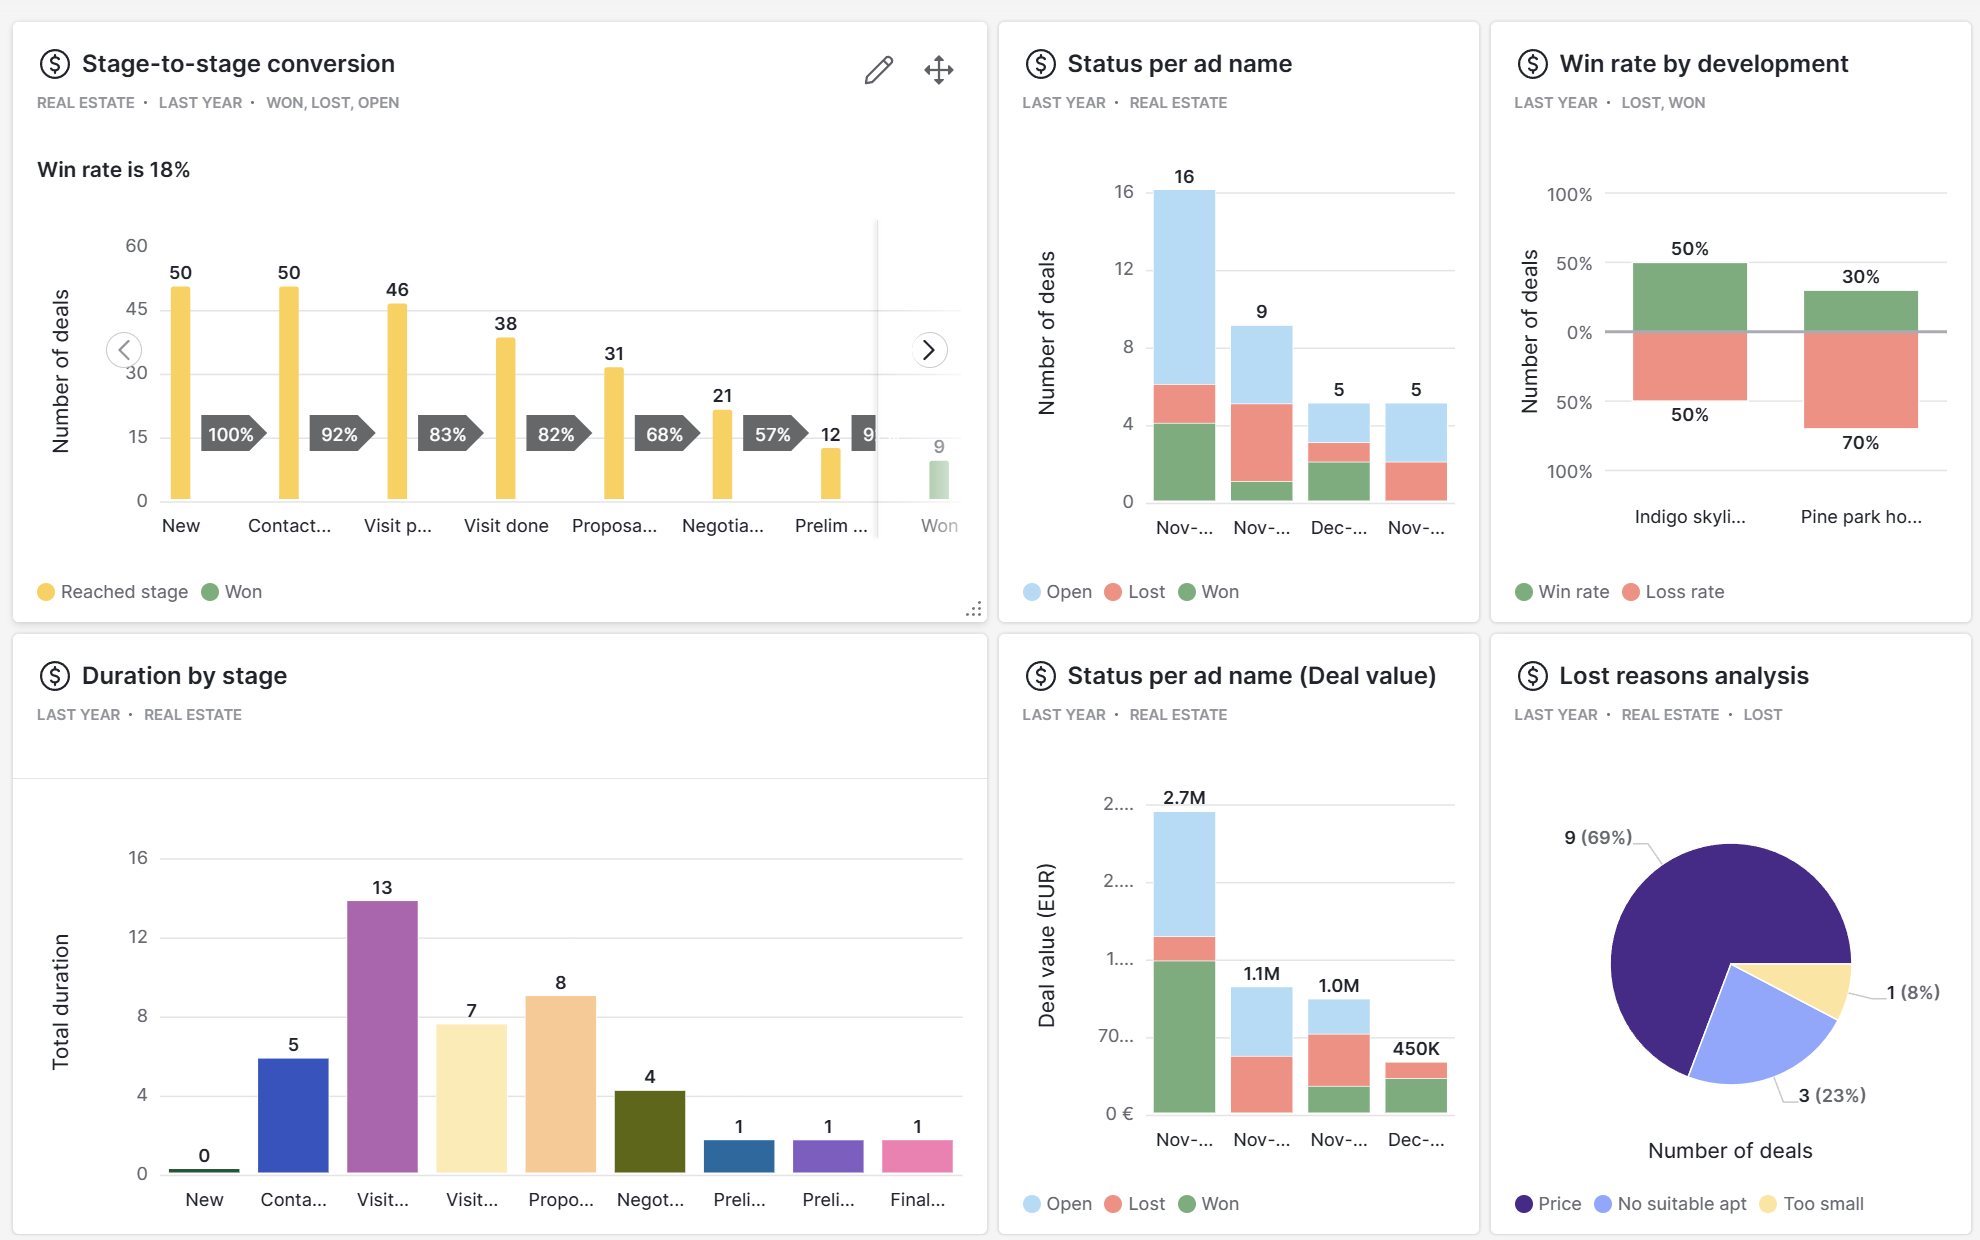
5. Stage-to-Stage Conversion
"Overall Win Rate" hides the leak in your bucket. You need to know exactly when the deal dies.
- Low Conversion from Discovery → Qualification? You have a lead quality issue (or your reps are bad at qualifying).
- Low Conversion from Proposal → Close? You have a pricing or value negotiation issue.
The Data: Persistence matters here. RAIN Group research shows that 80% of B2B sales happen after 5+ follow-ups, yet 44% of salespeople give up after the first one.
By tracking stage conversion, you can identify which reps are giving up too early and coach them specifically on follow-up tenacity.
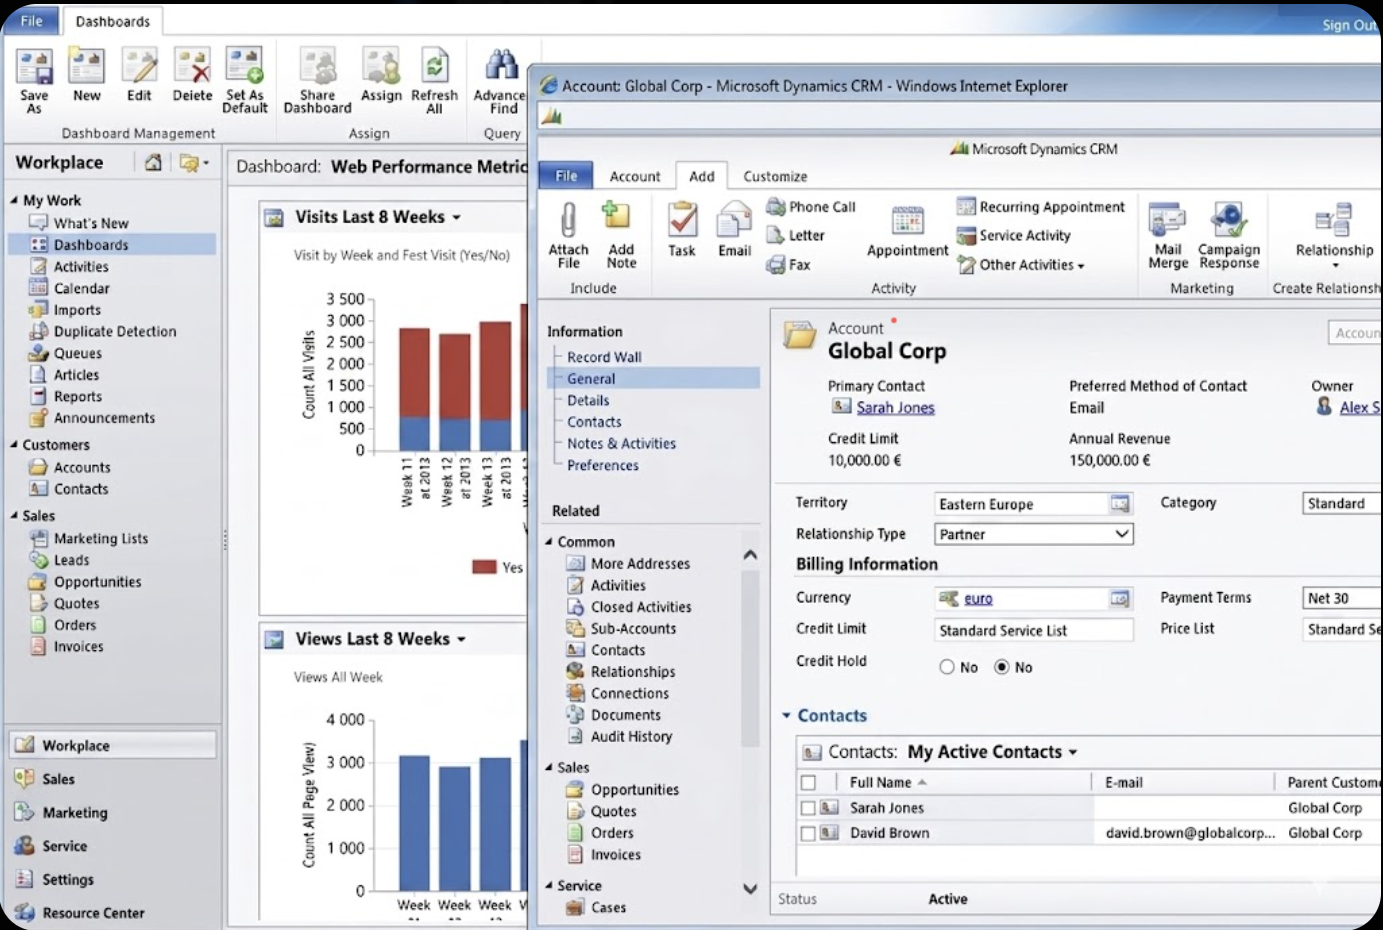
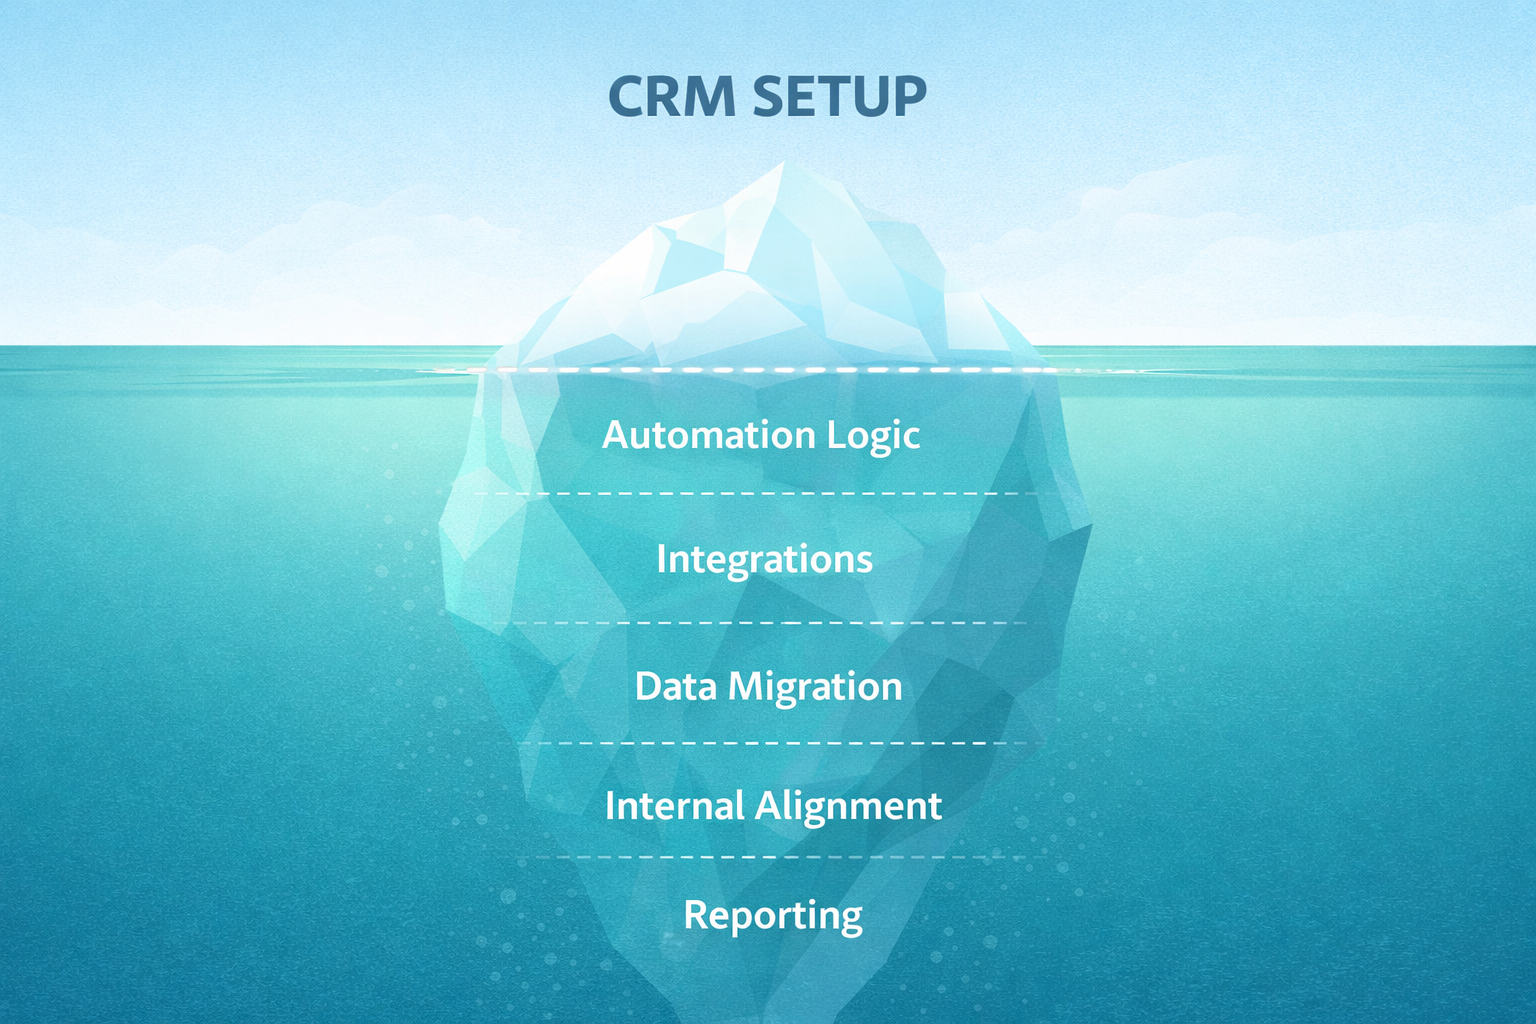
The Reality Check: Is Your CRM Broken?
You might be reading this list and thinking, "I’d love to track these, but it would take me 3 days of manual work."
Here is the hard truth. Your CRM setup is broken if you:a) Don't have this data.b) Don't automatically capture it.c) Can't access it without exporting to Excel.
Companies that systematically analyze this data see up to 20% higher conversion rates (Forrester). If you are running your 2026 strategy on gut feeling and "Total Revenue" spreadsheets, you are leaving that growth on the table.
What’s Next?
Now that you know what to track, the next question is how to track it without hiring a data scientist.
In the next post, I’ll dive into the technical side. I’ll walk through how to build a dashboard that tracks these specific metrics (using Pipedrive as an example) in under 15 minutes.